Visualizing Cassandra nodetool cfhistograms output using a histogram
Apache Cassandra includes a lot of functionality and tools which provide good visibility into your cluster health and performance.
A lot of this performance and health related metrics are exposed over the JMX interface and through the nodetool command line tool. nodetool is a simple wrapper around JMX interface which allows you to access some of the most commonly used attributes through a simple command line interface.
Another feature which was added recently and is available in Cassandra 1.2 is a feature called request tracing. Request tracing allows you see exactly what happens during a query executing and exactly how long each step takes.
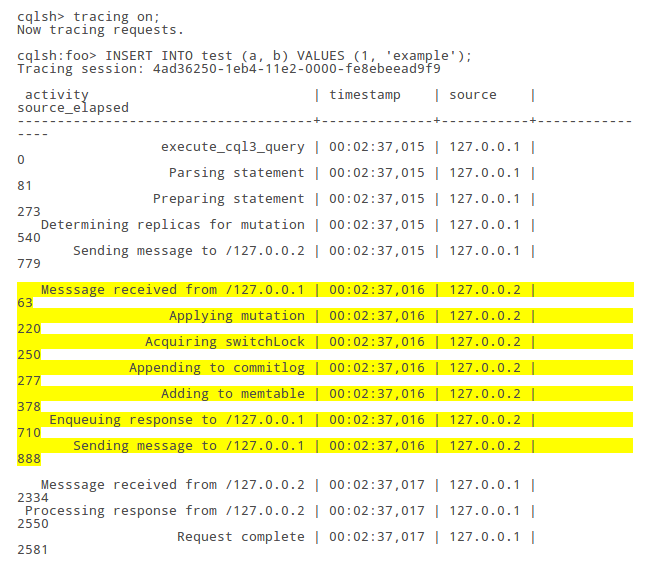 Example of the request tracing session output.
This data is very granular and includes everything from how much time it takes to parse the CQL query to how much time it takes to talk to other nodes in the cluster and read data from memory and / or disk.
This functionality is very powerful, but it’s only available in Cassandra 1.2.
Some of the Cassandra clusters we operate here at Rackspace, more specifically on the Cloud Monitoring team, don’t run Cassandra 1.2 yet. Because of that, I’m going to focus on another very useful feature which is available in the older versions of Cassandra today.
This feature is cfhistograms command exposed by the nodetool utility.
cfhistograms nodetool command
cfhistograms command prints statistic histograms for a particular column family. The output includes the following information:
- Distribution of the write latency
- Distribution of the read latency
- Distribution of number of sstables accessed during a read
- Distribution of the row size
- Distribution of number of columns in a row
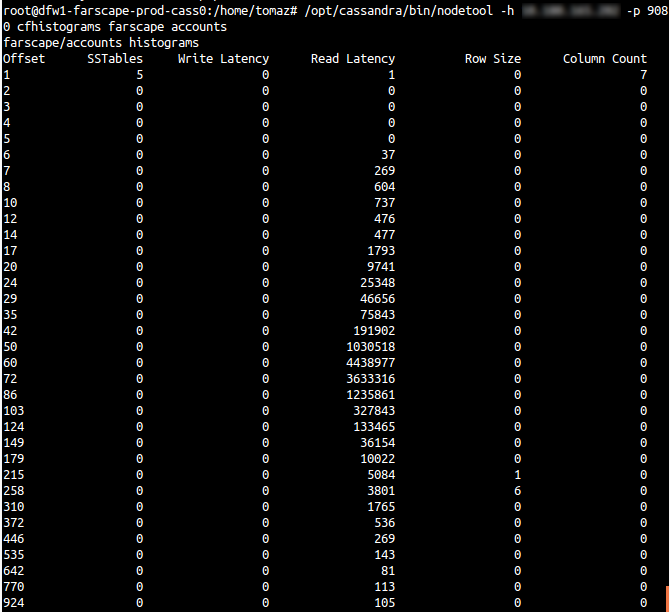 nodetool cfhistograms command output. Useful but hard to interpret.
This information is very useful, but the problem is that the default output is very convoluted and hard to read. If you Google around, you can find some good posts which explain how to interpret this output (e.g. Cassandra 0.7.x - Understanding the output of nodetool cfhistograms), but nevertheless interpreting the raw command line output is still time consuming and cumbersome.
Visualizing cfhistograms output
Around a year ago I was debugging a performance issues in one of our
clusters so I decided to write simple Python script which visualizes the
cfhistograms output using a histogram.
This script is nothing fancy, but it does it’s job. In the background it uses a couple of lines of Python and matplotlib to convert the raw text output into nice looking histograms.
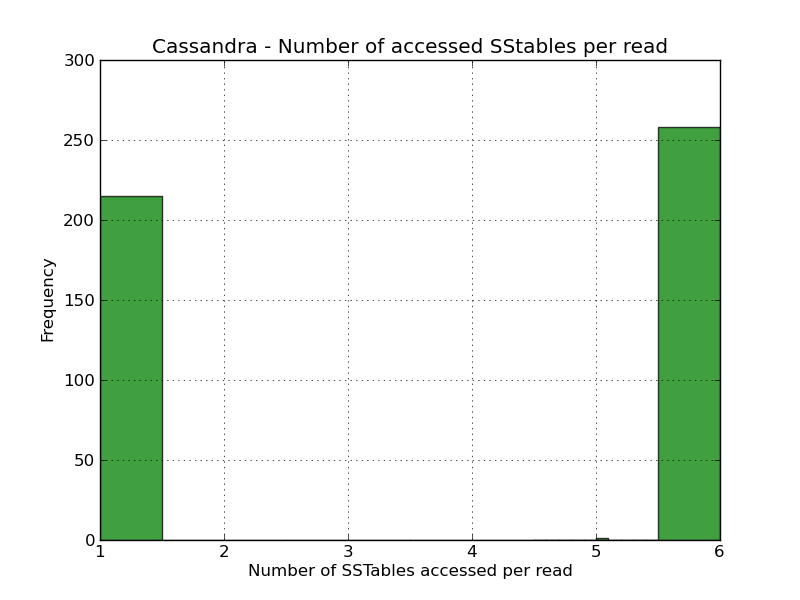 Histogram generated by the script. It makes identifying the outliers just by glancing over the image a lot
easier and faster.
Histogram generated by the script. It makes identifying the outliers just by glancing over the image a lot
easier and faster.Usage
Script is available as a gist on Github.
1. Download and chmod the script
wget "https://gist.github.com/Kami/5810229/raw/3528bc258095d3e415aba3850c8ca14a8afd5a76/cassandra_cfhistograms_to_histogram.py"
chmod +x cassandra_cfhistograms_to_histogram.py
2. Install the dependencies
pip install numpy
pip install matplotlib
Optionally, if you want nicer graphs you can also install prettyplotlib
library.
pip install prettyplotlib3. Run the script
./cassandra_cfstats_histogram.py --input=<path to the file with cfhistograms output> \
                                 --output=<directory where the histograms will be saved>
For example:
./cassandra_cfstats_histogram.py --input=/home/myuser/cfhistograms_output.txt \
                                 --output=/home/myuser/histograms-images/
All this script does it reads data from the input file, processes it and writes 5 different histogram files to the output directory.
Conclusion
I hope you find it useful and this script will allow you to more easily
interpret the output of nodetool cfhistograms command.
In the future, I will try to write more about how we used the output of this command in practice to identify and issue and misconfiguration in one of our clusters.
Edit 1 (September 13th, 2013): Modify script to be more robust and ignore any
additional data in the input before the actual header.
Edit 2 (September 13th, 2013): Modify script to work without an X server.
Edit 3 (September 29th, 2013): Modify script to use prettyplotlib library
(if available)
Edit 4 (September 30th, 2013): Make script more robust - don’t explode and
ignore columns where all the values are zero